- Coverage
Australia wide - Email:
info@PropertyLocation.com.au - 11/2020: New App on Bushfire Mapping
API-enabled Property Location Profile & Risk Analytics |
For all locations across Australia - A national platform |
Applications: Emergency planning & response, insurance underwriting & claims, news media & reporting, etc. Locations: Residential/commercial/industrial/educational addresses, incident and disaster sites, etc.Reporting with site radii of 200m & 1,200m for 72.8% & 100% national addresses, respectively.March 2017: Initial release | All reports are delivered in seconds via web APIs, downloads and emails April 2018: Version 4.3, incorporating exposure estimation and 2016 ABS census data (DataPacks including SEIFA 03/2018) January 2019: New web mapping, analysis and reporting App on exposure management For each location, we provide various forms of reporting, e.g. PDF report & GIF animation - PDF report Sample Report 1 (flood; Bellingen, NSW) | Sample Report 2 (bushfire; Lorne, VIC) Sample Report 3 (storm surge; Airlie Beach, QLD) | Sample Report 4 (landslide; Thredbo, NSW) - GIF animation Sample Animation 1 (riverine flood; Bundaberg, QLD) | Sample Animation 2 (riverine flood; Innisfail, QLD) Sample Animation 3 (riverine flood; Brisbane, QLD) | Sample Animation 4 (coastal vulnerability; Collaroy, NSW) - Both PDF report and GIF animation Sample Animation 5 ( PDF format riverine flood; Windsor, NSW) | Sample Animation 6 (PDF format riverine flood; Richmond, NSW) Sample Animation 7 ( PDF format bushfire; Hornsby, NSW) | Sample Animation 8 (PDF format bushfire; Bakers Hill, WA) For dynamic physical simulations (e.g. water level increase & bushfire propagation) with numerous realisations, please contact us.  04/2021 Tropical Cyclones Seroja in WA: Satellite imagery | Location profile reports | Animations, etc. 03/2021 Major Flooding in Eastern NSW: Satellite imagery | Modelling low-lying flood-prone areas (animation & PDF) | Tile maps on terrain & hydrology | Some quick analysis 02/2021 Bushfires in Perth Hills: Satellite imagery (before, during and after fires), detected hotspots, animations, etc. 01/2021 Bushfires in Adelaide Hills: Satellite imagery, detected hotspots, location profile reports | Related blog 11-12/2020 Bushfires on Fraser Island, Queensland: Satellite imagery, detected hotspots, etc. Link 1 | Link 2 2019-2020 Unprecedented Bushfire Season in Australia: Link 1 | Link 2 | Link 3 Hotspots detection and near real-time mapping: Link 4 | Link 5 03/2019 Tropical Cyclones Veronica and Trevor in WA and NT: Rapid exposure estimation | Historical tracks analysis, etc. 03/2019 Bushfires in Eastern Victoria: Satellite imagery | Rapid exposure estimation 02/2019 Tropical Cyclone Oma on East Coast: Satellite imagery | Location profile reports | Animations, etc. 02/2019 Flooding in Townsville & North Queensland: Satellite imagery | Location profile reports | Animations, etc. 01/2019 Bushfires in Tasmania: Satellite imagery | Exposure location profile reports, etc. 08/2018 Winter Bushfires in NSW: Satellite imagery | Exposure location profile reports, etc. 04/2018 Bushfires in Sydney's South-west, NSW: Satellite imagery | Exposure location profile reports | Animations, etc. 03/2018 Bushfires in Tathra, NSW: Pre- and post-fire satellite imagery | Exposure location profile report (~30 pages) Fire-prone areas animation | climate-warming trend, etc. 03/2018 Major Flooding in North Queensland: Satellite imagery | Flood-prone areas 03/2018 Bushfires in Victoria: Satellite imagery - SW Victoria | Alpine National Park 02/2018 Bushfires near Orange, NSW: Satellite imagery | Fire-prone areas |
|
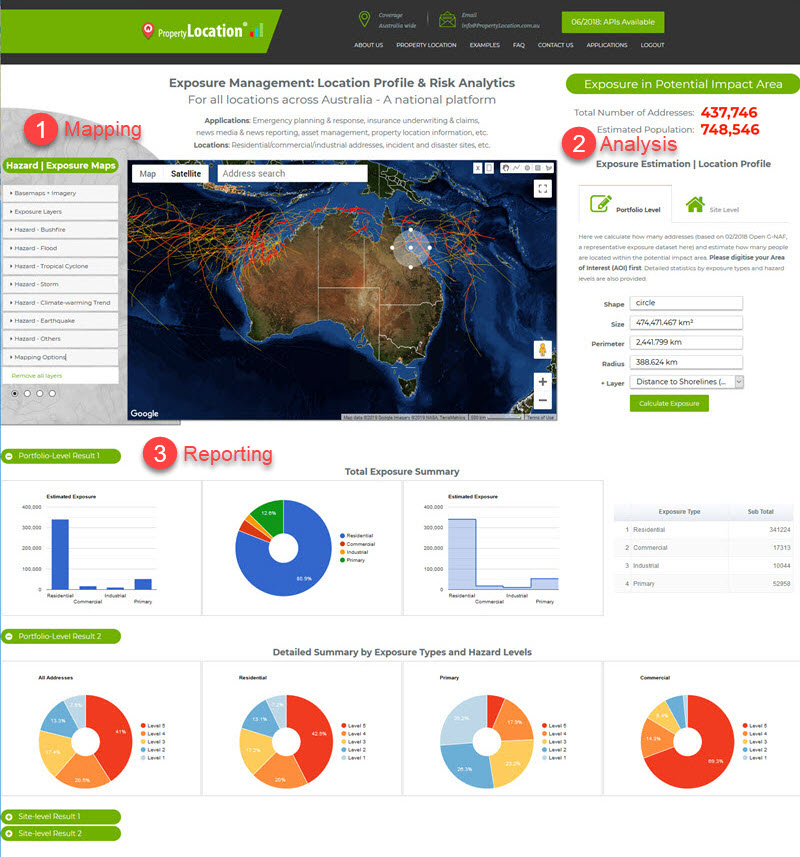
Figure 1: Portfolio level |
|
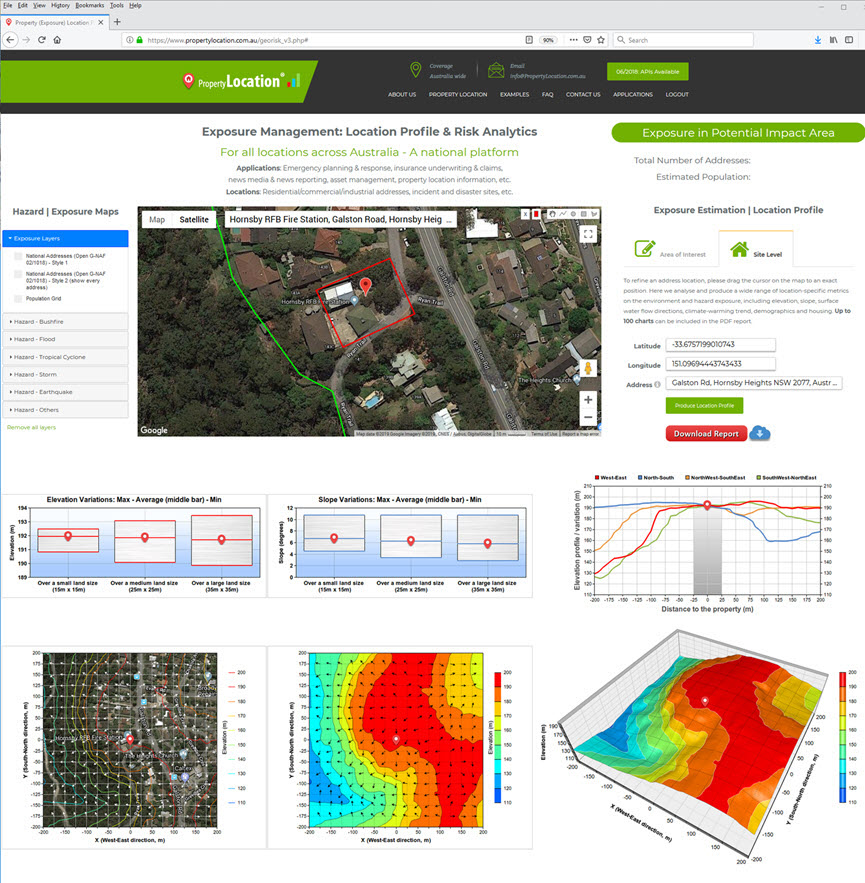
Figure 2: Site level |
| Access to an earlier version for report request |